


The Shape of Precision Oncology
Five years of biomarker-driven FDA approvals, drawn as a single map
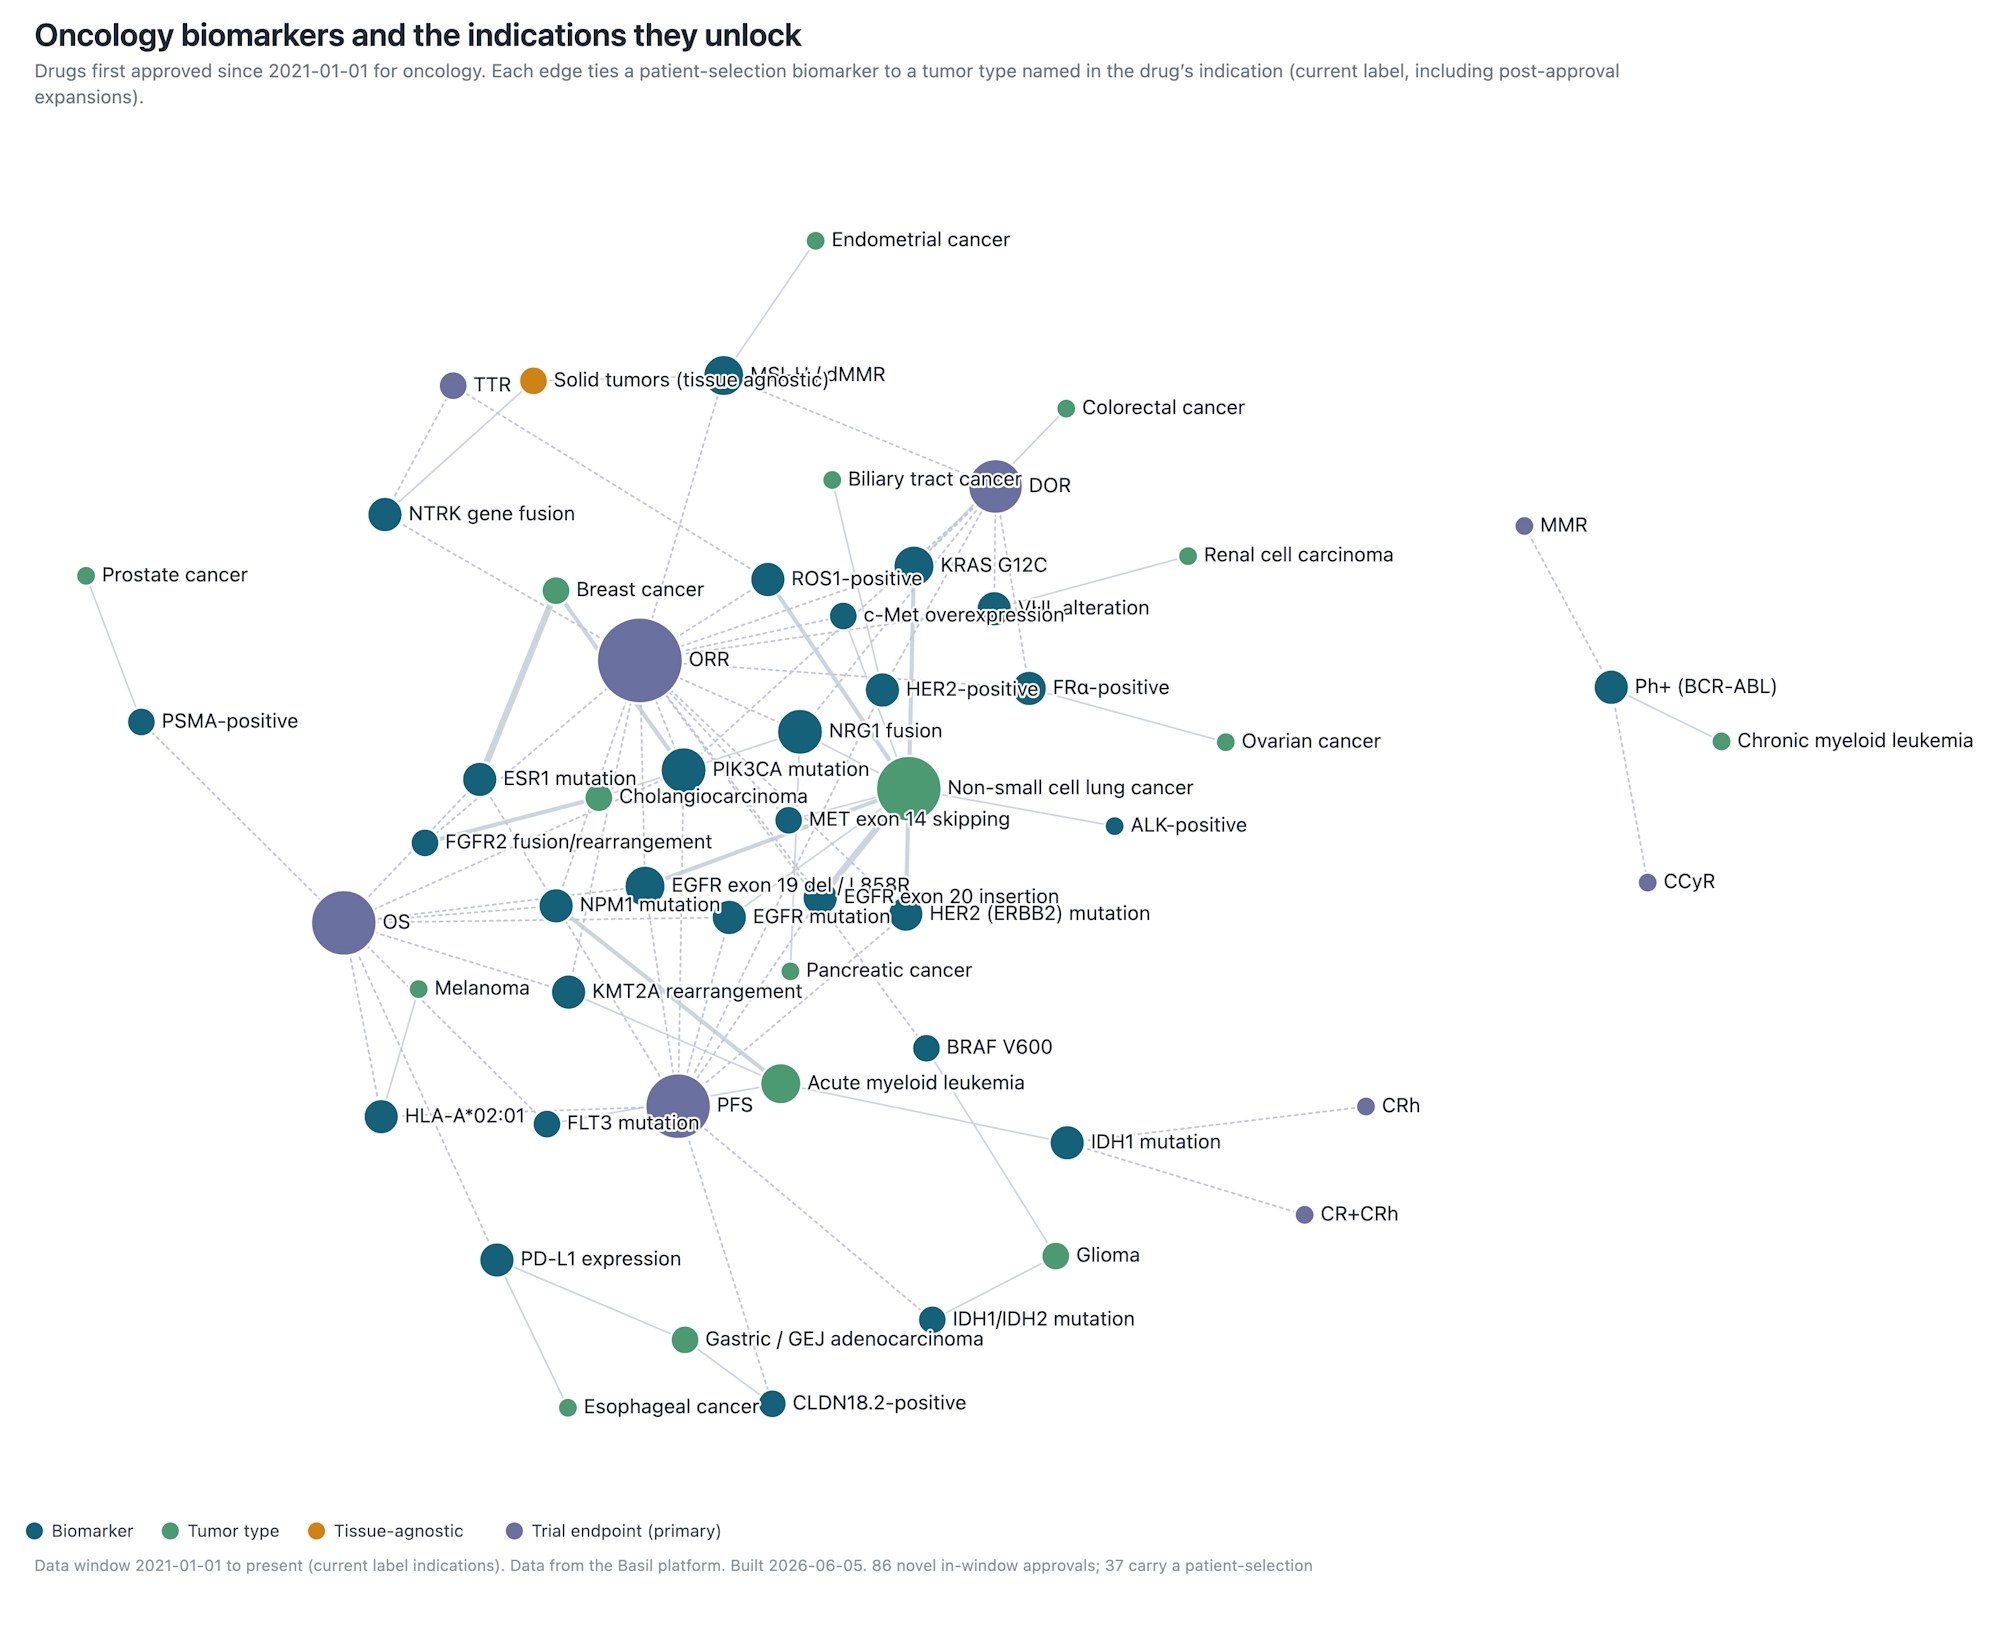
We mapped every biomarker-selected oncology drug the FDA has approved since 2021, 37 molecules, 29 biomarkers and 17 tumor types, into a single network, built end to end on the Basil Systems' platform data. Every approval, label, and endpoint behind it lives in Basil, is auditable back to the FDA source, and refreshes hourly. The structure tells a story that a list of approvals cannot.
Precision oncology is usually told one drug at a time: a new KRAS inhibitor here, a new antibody-drug conjugate there, a menin inhibitor for a leukemia almost no one had heard of two years ago. Read as a list, it is a stream of unrelated wins, impressive individually, but hard to reason about as a whole. The field has a shape, and you only see it when you put every approval next to every other one.
So we built that map, and we built it entirely inside Basil. Using the Basil Systems platform’s Regulatory / Approval Search, we pulled every novel oncology molecular entity the FDA first approved from January 2021 onward, then used Advanced Search to keep only those whose label names a patient-selection biomarker, reading the biomarker and the tumor type straight from the indication. We linked each biomarker to the tumor it unlocks, and pulled the primary efficacy endpoint for every drug from its FDA review package, all of it sitting in Basil and refreshed hourly. The result is a network of 37 drugs, 29 biomarkers, 17 tumor types and the trial endpoints that carried them, every node and every edge traceable to a Basil source document (none inferred).
A network is a different instrument than a spreadsheet. A list of 37 approvals tells you what happened; the graph tells you how the pieces relate, which tumors are crowded and which are wide open, which biomarkers behave like platforms and which stay boxed into one disease, and which regulatory path almost everyone took to get there. Those relationships are where strategy lives. Here is the biomarker-to-indication layer of the map:

1. Lung cancer is the gravitational center
One tumor dominates the map. Non-small cell lung cancer connects to ten distinct biomarkers, EGFR in three separate forms (exon 20 insertions, exon 19 deletions / L858R, and classic activating mutations), KRAS G12C, MET exon 14 skipping, ALK, ROS1, NRG1 fusions, HER2, and c-Met overexpression. No other tumor comes close; acute myeloid leukemia is a distant second at four biomarkers, and most cancers on the map connect to just one.
That concentration is not an accident. NSCLC pairs a large, biopsied, molecularly profiled patient population with a tumor biology rich in actionable driver alterations, so it has become the proving ground for the entire field. New targets are validated there first, companion diagnostics are built there first, and the same disease now subdivides into ever-finer molecular segments, each its own commercial niche. If you want to understand where precision oncology gets tested before it travels anywhere else, you are looking at it, and any sponsor entering lung cancer is entering the most contested square on the board.
2. A few biomarkers have gone tissue-agnostic, and they are the hubs
Most of the graph is biomarker-to-one-tumor. Two markers break that pattern and wire across tumor types: mismatch-repair deficiency / MSI-high (dostarlimab) and NTRK gene fusions (repotrectinib), each carrying an indication written for solid tumors regardless of where the cancer starts. On the map they converge onto a single shared “solid tumors (tissue agnostic)” node, the visual signature of biology winning out over anatomy.
The economics of that distinction are enormous. A tissue-agnostic label turns one approval into addressable disease across dozens of histologies, and it changes the development calculus: a basket trial enrolling on the marker rather than the organ, a single companion diagnostic, and a label that expands by biology rather than by repeating a Phase 3 in each new tumor. These are the markers that convert a drug from a single-indication product into a platform, and structurally, they are the hubs the rest of the graph bends toward.
3. But most biomarkers are still locked to a single cancer
For every tissue-agnostic marker there are a dozen tied to exactly one disease: VHL to renal cell carcinoma, FRα to ovarian cancer, PSMA to prostate, HLA-A*02:01 to uveal melanoma, CLDN18.2 to gastric and gastroesophageal cancer, KMT2A and NPM1 to acute leukemia, FGFR2 to cholangiocarcinoma. The long tail of precision oncology is still overwhelmingly one marker, one tumor.
There are good reasons the one-to-one pattern persists: many of these markers are defined and prevalent only in a particular lineage, the companion diagnostic is validated in that setting, and the registrational trial is powered in that population. Crossing into a second tumor is a fresh development program, not a label edit. That makes the structure of the graph genuinely informative, the agnostic hubs are the rare exception, not the emerging norm, and a sponsor sitting on a marker that could plausibly travel across histologies is holding something materially different from one that cannot.
4. When a biomarker attracts a field, it attracts a crowd
Several biomarkers pull in more than one drug, and those are the competitive battlegrounds. EGFR exon 20 insertions alone have drawn three approvals (mobocertinib, amivantamab, sunvozertinib); ESR1 mutations another three (elacestrant, imlunestrant and a third oral SERD in 2026); KRAS G12C two (sotorasib, adagrasib); FGFR2, ROS1, PIK3CA, NPM1 and HER2-mutant lung cancer two apiece. The moment a target is validated, the map shows the field converging on it. For competitive intelligence, the clusters are the story: they mark exactly where the differentiation, sequencing and label-expansion fights are happening now, long before they surface in a press release.
5. Almost everything ran on response rate
Overlay the primary efficacy endpoint each drug was approved on, and one node dwarfs the rest: objective response rate. ORR is the single largest hub in the graph, connecting to seventeen drugs, roughly half the cohort. Progression-free and overall survival follow at ten each, with the heme-specific endpoints (CR/CRh, MMR, complete cytogenetic response) trailing as small satellites. That is the endpoint signature of accelerated approval: single-arm trials reading out response rate in a biomarker-defined population, with survival or progression-free survival as the confirmatory follow-on.
The structural point is that the biomarker era and the accelerated-approval era are the same era. A targetable alteration plus a high response rate in a tightly defined population is the dominant path to a first oncology approval today, which is also why the confirmatory-trial obligations attached to these approvals matter so much, and why response-rate magnitude and durability are scrutinized so hard at the review stage. The endpoint layer is not a footnote to the biomarker map; it is the regulatory mechanism that made the whole map possible:
6. The frontier moved in 2024 to 2025
The approvals are not spread evenly. After a 2023 trough of four biomarker approvals, 2024 and 2025 surged to ten and eight, and, more importantly, they brought biomarkers onto the map that were not on it before: KMT2A rearrangements and NPM1 mutations (the menin inhibitors, revumenib and ziftomenib), CLDN18.2 (zolbetuximab), NRG1 fusions (zenocutuzumab), c-Met overexpression (telisotuzumab vedotin), and a second wave of HER2-mutant lung drugs.
That matters because new nodes, not just new drugs, are where the field actually advances. A second KRAS G12C inhibitor deepens an existing cluster; the first menin inhibitor opens a previously undruggable corner of acute leukemia. The map is not finished, and its outer edges, the newest single-tumor markers and the validated targets that still have no approval at all, are precisely where the next wave is being written. Watching which empty edges fill in, and how fast, is one of the most useful things a regulatory or competitive intelligence team can do with a view like this.
7. What this means for regulatory and medical affairs strategy
A network view is not just a picture; it is a precedent engine. Three takeaways:
- Read the precedent before the pre-submission meeting. If your asset’s biomarker already sits on the map with two or three approvals, the FDA has effectively set a template, endpoint, population definition, and companion-diagnostic expectation. A single approval search in Basil pulls that precedent set, with the underlying labels and review packages, so the clusters tell you what the agency will expect before you ask.
- Watch the clusters, not the headlines. The biomarkers pulling multiple drugs move faster than the announcements. That is where sequencing, differentiation, and label-expansion fights are live, and where competitive surprises come from. Because Basil refreshes hourly, a new approval lands in that cluster the same day it posts, not whenever the next industry roundup gets written.
- The hubs and the empty edges are the asymmetric bets. A marker that converts a single-tumor drug into a tissue-agnostic platform, or a validated target with no approval yet, is where the disproportionate upside sits. Built on live Basil data, the map makes both visible at a glance, and keeps showing them as the field moves.
How this map was built
Every node and edge above comes from the Basil Systems platform: the cohort from Regulatory / Approval Search: the biomarker and tumor type read from the FDA label indication, and the primary endpoint extracted from each drug’s review package. Reformulations, biosimilars, new salt forms, and diagnostic imaging agents were filtered out in Advanced Search, so the map reflects genuine first approvals of new precision medicines. Nothing was inferred from outside the source documents; the entire analysis, cohort to endpoints, was assembled in a single afternoon, and every point on it is auditable back to an FDA filing. And because Basil’s underlying data refreshes hourly, the same query rebuilds this map automatically as each new approval lands.
The shape of precision oncology is no longer hypothetical – it sits in data you can interrogate directly. Every approval, label, and endpoint behind this map is live in the Basil's platform, refreshed hourly and auditable back to the FDA filing. If you want to see where your biomarker, your tumor, or your competitor sits, that is exactly what Basil was built to show. Book a demo, and we will pull your corner of the map live.